
In my last column, I discussed how improved efficiency can enable consumption and increase demand rather than lead to conservation. This so-called counter-intuitive behavior is codified by economists under the headings of the Khazzoom-Brookes Postulate and the Jevons Paradox. In this column, I’ll turn from the general theory and look at these ideas in practice by analyzing oil consumption and associated prices/costs in the United States for the years 1949 through 2016.
But before diving into the numbers and performing a statistical analysis, I would like to take a small tangent to discuss the efficiency paradox and the apparent surprise and controversy it causes in economic circles. This last assessment is based on the commentary surrounding the common literature associated with the Khazzoom-Brookes Postulate and the Jevons Paradox.
Personally, I am perplexed that some economists find anything unusual in the notion that increased efficiency leads to wider consumption of a good or a wider adoption of a technology. Recent history is littered with examples. Take desk-top printing. Paper is a valuable resource; there is and should be tremendous pressure to properly use and steward the trees from which it is derived. Paper was far more expensive (in adjusted dollars) and scarce in the 1970s than it is today. One can barely go anywhere without finding reams of printer paper on sale; local grocery stores usually have an aisle devoted to office supplies (and some convenience stores as well). Electronic media, like PDF, even obviate the need for it and yet there is far more paper circulating per capita today than 40 years ago. Why? Because its value has far outstripped its cost despite the increasingly more efficient ways of producing it. The reason for this is that efficient production of paper and printers has opened avenues for use that were effectively closed to all but a handful over a generation ago. Professional printers were the only ones that could economically make attractive documents and signs back in the day; now anyone can. The efficient use of paper has enabled a whole new way of enjoying its benefits and has, concomitantly, increased the demand.
The interesting and more far-reaching question is whether oil consumption reflects the ‘efficiency paradox’ as well. There are plausible arguments that it should, based on the following analysis.
For the sake of argument, suppose that, on average, every person in the United States drove 100 miles each week. Further suppose that, on average, fuel efficiency was 10 miles per gallon and the price of each gallon was $4.00. Then the average demand for gasoline would be 10 gallons per capita per week. Finally suppose that there is an increase in fuel efficiency to 11.1 miles per gallon. We want to look at the possible responses to such a change. There are three basic ones.
In the first scenario, the average motorist, content with his 100-mile/week habit will buy 9 gallons of gasoline and will take the $4.00 he saves and direct it to other goods and services. In the second scenario, our average motorist says to himself that he’s already used to spending $40/week on gasoline and so he’ll buy the same dollar amount of gasoline (10 gallons) but he’ll drive a bit more for convenience or fun. In the third scenario, our motorist may think that since gasoline prices have come down in a relative sense – the cost per mile he bears is now less – he will finally take those weekend trips to the beach he’s always dreamed about and he steps up his consumption to 12 gallons a week.
A bit of reflection on the above scenarios should drive us to two conclusions. First, very few people are likely to fall into the first scenario. All of us dream of doing more than scarcity allows. Second, the above analysis assumes that the only thing that changes is the behavior of the average motorist. Two significant drivers are left out: 1) the response of the oil producers to the changes in fuel efficiency and 2) changes in the motorist population. It is very unlikely that the oil producers will do nothing in the face of increasing fuel efficiency. Not wanting to risk a drop in demand they are likely to down-adjust the price as that is easier to do compared to down-adjusting the supply. The latter course of action requires laying off workers, scaling back factory production, and curtailing distribution all along the supply chain. It is also very unlikely that the average motorist can be thought of as anything other than a statistical snapshot in time. People are born, grow, age, and die. Tastes, habits, and behaviors change. And the number of people in the population grows as a function of time. These later factors make it far more difficult to analyze real-world data like oil consumption.
To that end, I pulled 4 sets of data to try to see the Jevons Paradox in action. These were: 1) total oil consumption by day (thousands of barrels), 2) average raw cost per barrel in dollars, 3) US population by year, and 4) GDP by year (raw not inflation-adjusted). The sources are: Item 1, Item 2 (both from www.eia.gov), Item 3, and Item 4 (both from www.multpl.com).
The first graph of the data shows a comparison of total oil consumption and per capita use over the time span from 1949-2016.
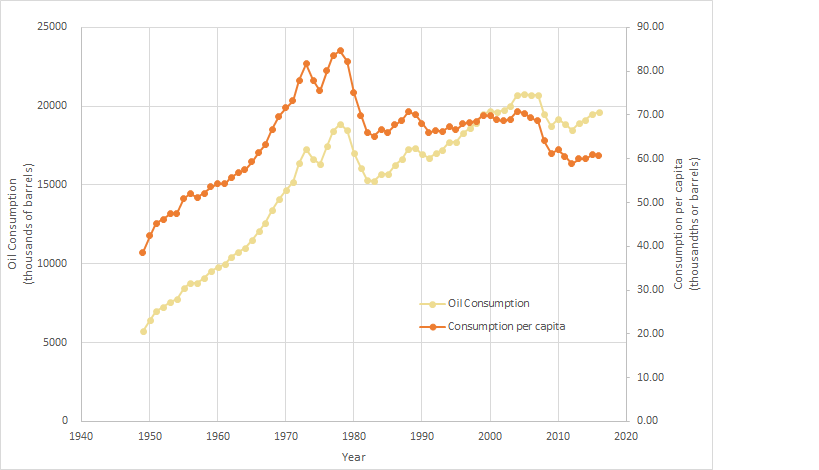
With some minor variations, total oil consumption has risen steadily, except for three periods: 1) the aftermath of the oil shocks in the mid-1970s, 2) the breaking of stagflation in the early 1980s, and 3) the Great Recession of 2008-2010. Interestingly the total oil consumption per capita remained flat from about 1982 to 2008, a 26-year period where, while fuel standards were getting continuously better, oil demand per capita remained steady. This is direct evidence of the Jevons Paradox and it indicates that the vast majority of us fall into scenario 2 – we’ve allocated a certain amount to spend on gasoline and we drive appropriately so that we consume roughly that amount on average, regardless of how many extra miles we record.
Further support for the idea that most consumers fall into scenario 2 is found in the following plot of total oil costs as a fraction of GDP, which is a reasonable measure for judging the relative cost of oil in the economy.

Note that oil prices held fairly steady (between 2-4% GDP) through much of that 26-year time span where oil consumption per capita remained constant. Had the majority of us been scenario-3 types, the additional relative price reduction (efficiency and actual price reduction) would have spurred a rise in per capita consumption.