
Stagflation and the Phillips Curve
On September 4th of this year, David P. Goldman wrote an intriguing article for Asia Times, entitled Stagflation rears its ugly head in US payroll data. Goldman presented time series data for job growth (blue curve labeled ‘Payrolls’) side-by-side with data over the same period for wage rates (orange curve labeled ‘Earnings’). Both series are presented on a normalized scale indicating that the data should be interpreted as roughly percentage changes. The data show both localized regions (Dec. 2020, Apr. 2021, and Aug. 2021) and mild overall negative correlation between the two curves. When job growth was down (Nov. to Dec. of 2020) wages rose and when job growth was up (Dec. 2020 to Mar. 2021) wage rates fell.
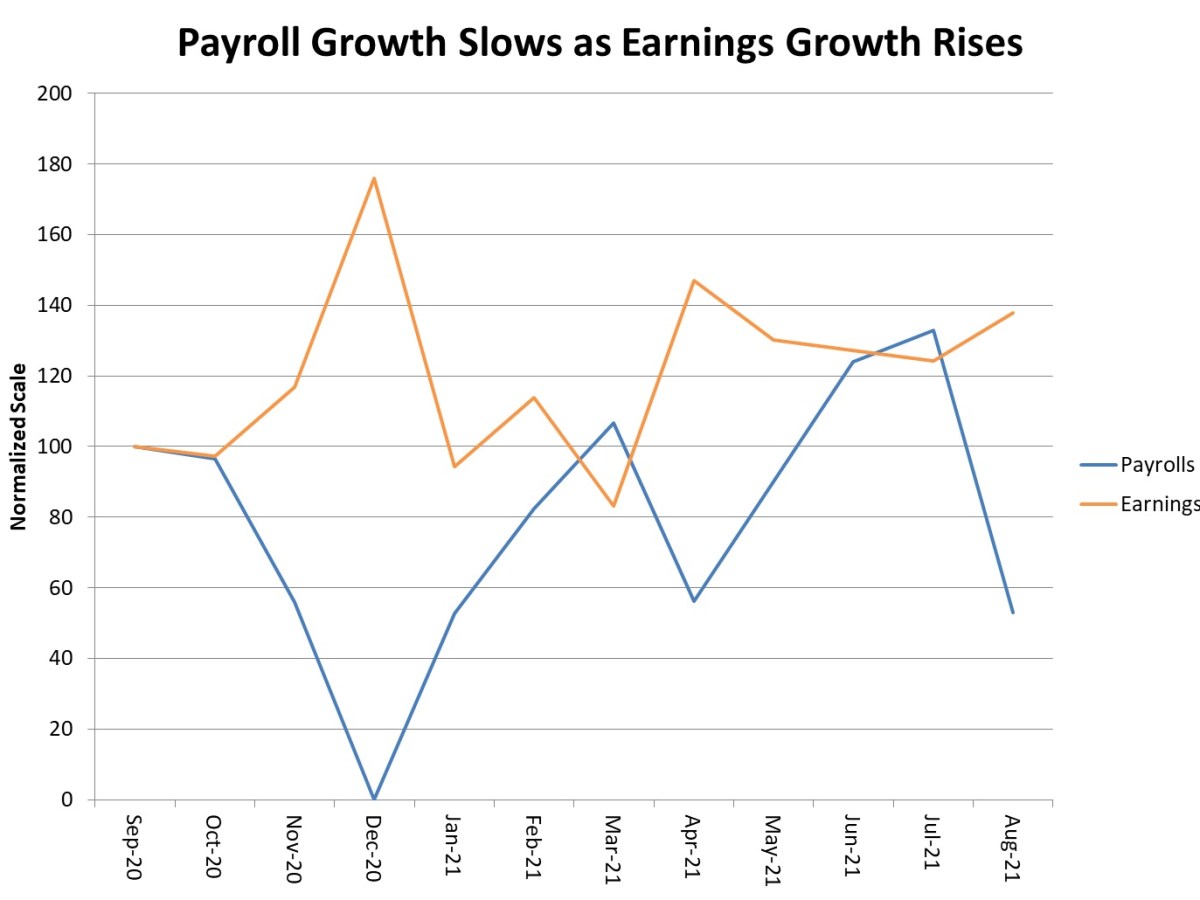
These observations led Goodman to conclude that stagflation was just around the corner; a conclusion that should scare anyone who had the misfortune of living through the 1970s.
For those who don’t know, stagflation is a period of time in which an economy experiences both high inflation and high unemployment, the latter of which signals slowed or stagnant economic growth. Prior to the onset of stagflation in the United States from about 1973 to its final defeat in 1984, a firmly entrenched point-of-view in economics circles was that stagflation was impossible because the unemployment rate and the rate of inflation were inversely correlated, with unemployment high when inflation was low and vice versa.
Roughly speaking, the argument to support this beliefs goes as follows. When unemployment is high, the amount of wages within the economy falls and there are too few dollars chasing too many goods. The lower relative spending power across the economy necessitates a drop in prices and inflation drops. When unemployment is low, the amount of wages in the economy rises and, conversely, there are too many dollars chasing too few goods. This time the higher relative spending power causes prices to rise and inflation increases
The empirical data that was used to justify this viewpoint comes from what is now known as the Phillips curve. The Phillips curve, which was published in 1958 by the economist William Phillips, consists of a scatter plot where each point consists of the unemployment rate and percentage change in wage rates for a given year. The data for the original plot

Image by Houdinipeter – Own work,CC BY-SA 4.0, Link
show what seems to be a nonlinear negative correlation between these two measures. The Phillips curve uses the percent change in wage rates as a proxy measure for inflation.
These observations seemed to convince many people that economic policy could rely on a single knob to simultaneously adjust unemployment and inflation. However, the economy exhibits behaviors more complicated than a simple, approximate one-to-one relationship between unemployment and inflation.
In 1967 and 1968, economists Milton Friedman and Edmund Phelps began arguing that the Phillips curve was a short term trend that resulted from conditions that were not universal. Friedman’s work centered on the roles of government fiscal and, in particular, monetary policy played in keeping inflation and unemployment under control.
The mathematical structure that Friedman and company used to explain when the conditions are just right for using the Phillips curve (or rather the concepts behind it) is rather complicated and basically involves the recognition that there are two types of unemployment – a natural or structural unemployment, which reflects the fact that at any instant there will be people in the work force who are transitioning from one state of employment to another, and a deviation from this state due to economic uncertainties and fluctuations. That said, the fact that the Phillips curve can’t hold always is easily seen by the initial heuristic arguments used to support it.
There is simply no reason to believe that when unemployment is high that there would be fewer dollars chasing more goods so that inflation should be low. Those unemployed workers must have been making goods or providing services to somebody before they became unemployed. Therefore, there must be occasions where the number of goods falls faster than the unemployment rate raises and inflation must kick in. Likewise, when the economy is at full employment (meaning that the unemployment rate is at or below the structural rate) workers have more money but they are also producing more goods to be chased.
In any event, whether the theory is understood (or even if it is sufficient to explain all the events of the macroeconomy) is not important because facts bore out the predictions and models roughly 5 years after Friedman and Phelps work in the late 1960s.
In 1971, then President Richard Nixon put into place price and wage controls that shocked the economy. About 2 years later, in 1973, OPEC cut worldwide oil production. The US economy went into a recession with high unemployment and high inflation. The pain of those years is well remembered by those of us who lived through (even and odd days for buying gasoline being one of the most vivid examples). The stagflation pain persisted for nearly a decade with mortgage rates climbing from a range of 7 to 8 % in the early 1970s, to 16.6% in 1981 (according to Rocket Mortgage’s article Historical Mortgage Rates From The 1970s To 2021: Averages And Trends For 30-Year Fixed Mortgages) – a crushing reality immortalized in comedy in the movie Ghostbusters.
Thankfully, Freidman’s message that inflation is primarily controlled through monetary policy independently of the role that fiscal policy plays in unemployment took hold and decades of prosperour growth followed on the heels of the malaise the US experienced during the bulk of the stagflation era.
Nonetheless, the idea that inflation and unemployment go hand-in-hand persists to this day. As discussed in an earlier post entitled What Does the Fed Do Now?, even as late 2017 there were people who seriously believed that a single policy could serve to meet the two macroeconomic goals of sustained growth and reasonable prices. Interestingly, the Fed has, since the time of the publication of that blog, taken down their Chair the Fed game. A visitor to that old link is met instead with the following message
A monetary policy game
Thank you for your interest in the monetary policy game, Chair the Fed. The game has been a useful and fun tool to learn more about monetary policy. However, the Fed has updated its approach to monetary policy, and the changes are not readily accommodated within the existing structure of the game. As of June 1, 2021, the game is no longer available.
You can learn more about the Fed’s policy updates here. Be sure to also check out FOMC Rewind, a texting video series that summarizes the FOMC’s meeting statements.
Whether this change indicates that the Fed has completely abandoned their previous stance on correlation between unemployment and inflation (the concept behind the Phillips Curve) or whether it was simply politic to stop publicizing it remains to be seen. Hopefully, like Goldman, they are looking out for the beginning signs of stagflation and are willing and able to make decisions that keep it from doing more than rearing its ugly head.