Uncategorized

Gunless and Gunrunners

Suppose I told you about a man who both favored gun control, pushing through legislation banning firearms, and who was arrested for gunrunning?  Would you conclude that the man was unstable and irrational?  Or maybe that he was simply a hypocrite?  After all, how to unite this two opposing positions?  Well, Leland Yee is just such a man and, if you give me just a bit more of your time, I think I can convince you that he is an excellent example of how opposing viewpoints can rationally unite around a common goal.

Our common ideas suggest to us that two opposites can never meet.  Hot and cold don’t exist together any more than light and dark do.  As kids in school, our teachers presented the idea of the number line with numbers greater than zero to the right and those less than zero to the left.  Upon this construction, many of us would rank opposites at extreme ends of a line – for every positive there is a negative.  Thermometers are designed this way, and we tend to think about every other situation with ideas in opposition in the same manner.

The most familiar notion of ‘opposites’, which we see daily within the political discussion that surrounds us, is the use of phrases like ‘right’ and ‘left’ to describe supposedly politically opposite points of view.  The idea is that the ‘far right’ and the ‘far left’ have nothing in common from a political perspective.  But this notion is quite wrong and it is a fairly usual occurrence that ‘right’ meets ‘left’ on matters of regulatory policy.  The conceptual model is no longer a straight line stretching indefinitely in opposite directions but more like a circle wrapping back to close on itself.

To see how ‘right’ can join ‘left’ in matters of regulation, consider the situation of those both for and against the use of alcohol during the age of Prohibition.  From the years 1920 to 1933, the United States made it illegal for anyone to produce or import, store, transport, or sale alcoholic beverages.  These restrictions, codified into the Constitution through the 18th Amendment, were championed by a variety of religious and social welfare groups.  The American Temperance Society, the Anti-Saloon League, and the Women’s Christian Temperance Union were notable in their push for this amendment.  There was even a political party, called the Prohibition Party, which ran on a platform advocating abstinence from spirits (curiously it still exists to this day).  Collectively, these voices were known as the ‘drys’.

The idea these ‘dry’ groups had was that the use of strong alcohol spirits rotted the moral fabric of society.  Numerous problems were laid at the feet of alcohol consumption, including prostitution, domestic abuse, and declines in public health that affected the lower-class worker.  Several states experimented with the ban of the ‘demon in the bottle’, including Maine and Kansas.  Eventually the idea of federal alcohol ban caught hold, strongly backed by religious groups, predominantly comprised by the Methodists and Baptists, and women’s groups exercising their new right to vote.

Once the 18th Amendment went into effect, Congress passed the Volstead Act to provide the legislative muscle to enforce the ban nationwide.  Rather than eliminating the ‘specter’ of alcohol once and for all from the United States, Prohibition created a new segment of the economy called bootleggers and rum runners.  These ‘entrepreneurs’ found a need they could fill, and a rich and complex black market was developed across the country.  This underground economy was populated by some of the most notorious and socially unacceptable citizens the country has ever seen – the likes of Al Capone and Dutch Schultz.  Because these criminal syndicates amassed huge fortunes providing illegal booze (often for the rich and well-placed), they also favored prohibition.

In the end, the country had two diametrically opposed groups, the moral and religious ‘drys’ and the immoral and criminal bootleggers, both on the side of Prohibition, with the rest of the ‘wets’ in the country suffering as a result.

This peculiar circumstance of opposite groups uniting around a common goal led the regulatory economist Bruce Yandle to coin the phrase Bootleggers and Baptists to describe the situation.  The idea here is that the two groups, relatively small though they may be, provide the necessary ingredients for politicians to align with each of them.  The bootleggers provide the behind-the-scenes motivation through their possession of money while the Baptists provide the moral cover that a politician needs to look like he is acting in the interest of the common good.  Done in this fashion, the two-sided coalition between these opposite extremes can be far more successful in getting laws that favor their position than either a single side or the larger but unorganized middle can. Examples of the Bootlegger and Baptist mechanism can be seen in a variety of modern regulatory positions, including debates over global warming, gambling legislation, blood donation, wine regulation, and more.

And this brings us to Leland Yee.  For those who aren’t familiar with him, Mr. Yee is a Chinese immigrant who, from the age of three, was raised in San Francisco.  By education and profession he is a child psychologist, but within about a decade after he earned his PhD he had transitioned into politics, starting with his tenure on the San Francisco School Board.  Yee then moved onto the California General Assembly and finally to the California Senate.

During his tenure in the California State Legislature, Yee used his background as a child psychologist to provide a justification for a variety of weakly-supported positions on violence and gun control.  He authored controversial pieces of legislation banning sales of ‘violent video games’ to minors even though there is no well-established link between video games and violence.   These laws were eventually ruled unconstitutional, but that didn't stop Yee from pressing the dubious connection between violence and electronic entertainment for years.

He then turned his sights on gun violence.  A strong advocate for gun control, Yee was awarded a position on the Gun Violence Prevention Honor Roll by the Brady Campaign.  In addition to his outspoken positions, Yee helped to craft two of the most restrictive gun laws at the state level in the entire country.  He even appeared on the national show Stossel on Jan. 18th, 2013 where he firmly defended gun control saying “What is the lesson that we adults are saying to kids?  That when you are a child and you grow up, to solve your problem, carry a gun. And that is not the life lesson we ought to be teaching children.”

Shortly afterwards, on March 26, 2014, charges that Yee had engaged in a conspiracy to deal $2.5 million worth of firearms without a license and to illegally import firearms from the Philippines surfaced.  The champion of California gun control was now accused of orchestrating one of the state’s largest, uncontrolled trafficking in guns.  Yee was now simultaneously playing both gunless and gunrunner.

Many people hang the hypocrite label around Yee and dismiss his behavior as an aberration of a man whose private conduct doesn’t live up to the public standards he endorses.  While true on the surface, this trite analysis fails to take into account the rational and intelligent course of action he employed.  His behavior was a direct consequence of enormous investiture of power in regulators at the state and federal level.  Every step he followed was consistent and logical if examined from the assumption that Yee was first and foremost interested in the welfare, benefit, and position of Yee.

The lesson here is that we should take care in requiring government to regulate our economic activities and in giving that government the power to do so.  When we make legislators and regulators arbiters of economic activity we endow them with the power to be brokers for small but vocal and influential special interest groups.  Leland Yee’s rise and fall should serve as a case study for how the gunless and the gunrunners can ruin it for the rest of us.

What is Capital?

Most people have a fixed idea about the meaning of the word ‘capital’.  They tend to think of it strictly in materialistic terms as money or goods that allow a business owner to produce products and earn a profit.  A factory filled with machines or a bank brimming with money to loan comes to mind.  Of course, there is nothing wrong with that definition as far as it goes – it simply doesn’t go far enough.

The word ‘capital’ is defined variously by Webster’s dictionary (3rd definition) as:

  • A stock of accumulated goods,
  • accumulated goods devoted to the production of other goods,
  • accumulated possessions calculated to bring in income,
  • net worth,
  • advantage or gain,
  • a store of useful assets or gain,

the general theme knitting all these definitions together being that capital is a set of assets or advantages (things of net worth) that promote the accumulation of other assets or advantages of the same or different kinds.  So, the commonly held view of capital is correct but limiting.

Why does it matter how capital is defined?  It matters because, as a society, we continuously craft political structures and laws that limit what can be done with one type of capital while allowing other types of capital unfettered reign.  We are also in a better position to understand the motivations and the accompanying behavior of others if we can perceive what marketplace they are actually engaged in and what capital they are trying to accumulate.

In the rest of this post, I am going to explore the two most common types of hidden capital: reputation capital and political capital.

Reputation Capital

How familiar is the following scene?  The latest sports news comes on the radio or television and the announcer coolly states that so-and-so has just signed with some-such team for millions of dollars, making him the highest paid player at his position.  A friend of yours turns to you and says “how much money does one man need?”  Another friend responds by saying something like “It’s not about the money!  He just wants more than the other guys.  He just wants to be known as the best player in world.”  What the player in question is doing is building reputation capital.

Alex Rodriguez is a prime example of this.  His early success as a baseball player garnered him a reputation as a great ball player.  That reputation, in turn, garnered him a chance to play in bigger venues, which in turn grew his reputation.  The money was a secondary affair as his fame was really the means to the end.  It opened doors for him, the entire country talked about his contract, his lifestyle, and his legacy.

This is all innocent enough, and A-Rod’s celebrity fame and eventual infamy did not actually shape the economic or political sphere very much.  Outside of his influence on America’s pastime and popular culture, his mark will soon disappear.

Much more interesting and worthy of a skeptical eye are the so-called ‘paragons’ of society in whom is invested a lot of trust.  Journalists and scientists fall squarely into these categories.

Take the recent fall from grace of NBC’s pride and joy, Brian Williams.  Whether you call his fabrications exaggerations or outright lies, it is clear that he has played fast and loose with the truth.  But why did he do it?  I think his behavior is best explained by the model that he was trying to build his reputation as a gritty journalist.  His fantasies related to his time in Iraq or his encounters with dead corpses and armed gun men in New Orleans in the aftermath of Hurricane Katrina were meant to build capital with his viewers.  He intended his audience to regard him as an objective journalist who would back down before nothing and no one.  From such a position, he wielded great power and basked in the adoration of fans and the admiration of his colleagues.  He achieved assets and advantages that mere money could not buy.

University professors and academics engage in their own unique marketplace.  They are first and foremost tradesmen whose primary focus is to sell their ideas to each other and to society as a whole.  Journal articles, published books, and television and radio appearances are their currency, and their academic reputations are their capital.  Their wealth is measured in terms of the number of times their article is cited by peers, or how many of copies of their book were sold, or how many tweets and postings their TV appearance generated.  As their reputation grows, so does their power, even though very little in the way of money changes hands.

Political Capital

No matter where you work or volunteer, there are always a few people who are at the center of the institution.  These are the people who get things done by pulling strings, facilitating compromises, and horse-trading between one group and another.  These people engage in the marketplace of political capital, and the favors they give and receive are the currency.  They hold and wield power in the institution, and the larger the institution the greater the power, political capitalists in governmental positions being the most influential.

Political capitalists in government fall into two classes depending on whether they are elected or appointed and in the public eye (e.g., John Boehner or Samuel Alito), or they are far removed from general scrutiny (e.g., the head of the EPA).  In both cases, even though their assets and advantages are never translated into a monetary value, these people are able to buy and sell for goods and services just the same.  The public only thinks about this marketplace when an elected official grossly abuses their capital, as in the case of Bob McDonald, who was recently convicted of corruption for ‘selling access’ to his political capital in exchange for financial compensation.  In other words, the public doesn’t seem to care when the bartering is done strictly in terms of political favors – even though such bartering may lead to material gain on all sides – but only seems sensitized when political capital is turned into cash directly.

Regulating Marketplaces

As I alluded to above, the major reason to care about how capital is defined is to level the playing field when it comes to how different types of capital are accumulated, spent, or exchanged.  As a society, we tend to regulate and focus on financial or monetary capital and ignore reputation and political capital.

I’m not objecting to the capitalists that trade in either of these marketplaces, nor am I objecting to their accumulation of assets and advantages.  I do object to the thoughtless position that fears the business man and his accumulated financial wealth but embraces the celebrity and his dominating reputation.  I’m against laws that limit the modes of speech and the exchanges of ideas because they are purchased by money but leaves unfettered the speech and exchange of ideas that are bought through political favoritism.  I don’t understand why society is willing to be suspicious of one and not the others.

I’m skeptical across the board.  The accumulation of capital is not a bad thing, in and of itself, and I am willing to give the person who has acquired any type of capital the benefit of the doubt that he has earned it.  But the use of that capital is no less corrupting if it is based on reputation or political connections than if it is based on cold hard cash.

An Ultimatum You Can’t Refuse

What do the terms ‘greedy capitalist’ and homo economicus have in common?  Both terms are used, albeit with different connotations and by different groups, to describe a member of a society who pursues his own rational self-interest, trying to maximize it with each decision made.  But what is rational self-interest?  How do you define it? What is being maximized? And is the pursuit of one’s own self-interest necessarily incompatible with being a good neighbor? At the crux of these questions is the definition of rational self-interest.

Traditional economic analysis tends to view self-interest solely within the material context.  Much like playing a board game, the success that you have had in maximizing your personal self-interest is completely judged by the amount of stuff you’ve accumulated.  Cars, houses, jewelry, and money are all victory points that allow a person to rank themselves.  You can declare yourself to have arrived at the good life when your house is bigger, your car more expensive, your jewelry more gaudy, and your bank account larger than the Joneses' down the street.  In this view, a rational person never fails to make a decision that increases his material wealth.  This, then, is the definition of homo economicus – an individual who tries to maximize his utility when he is a consumer, and his profit when he is a producer. You can go one step further in this description if you believe that the wealth one person enjoys is often or always at the expense of another.  In this case, you would characterize a person pursuing his self-interest as a ‘greedy capitalist’.

But is this really how people act?  It is true that we can find excellent examples of miserly, parsimonious, and bitter old men in literature.  Scrooge in Dickens’ A Christmas Carol and Old Man Potter in Frank Capra’s It’s a Wonderful Life come immediately to mind.  And certainly there are people who take materialism too far, but does that mean that the system as a whole is corrupt or corrupting?  I think not.

There is a fascinating game, in the sense of game theory, that is often used to determine the degree to which people will tend to maximize their utility by following their own rational self-interest.  It’s called the Ultimatum Game.

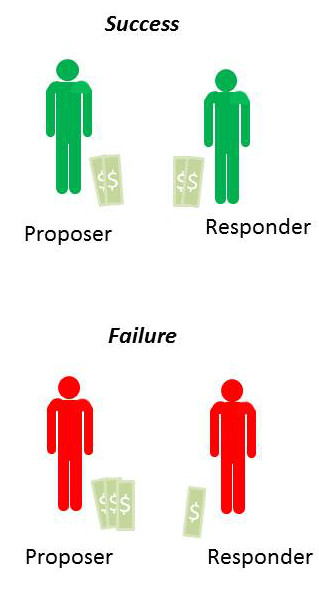
It works essentially like this.  The game begins when the game administrator (shown in blue below) approaches two random people with a pile of cash and invites them to play.

Game_begins

The rules are simple.  The administrator will randomly designate one of them as the proposer and the other as the responder.  The administrator will give the proposer the money and the proposer will decide on a split between himself and the responder.  The responder’s only move is to decide to accept the proposal or reject it.  If the responder accepts the proposal, they both get to keep the money in the proportions defined by the proposer.  If the responder rejects the proposal he and the proposer walk away empty handed.  The administrator emphasizes that the proposer gets only one chance to make an offer – there are no negotiations – and that this is the only time they will be playing this game.

Assuming that both players are homo economicus, the results of the game are easy to predict.  The proposer should keep most of the money for himself and give only a small percentage, nearly zero, to the responder, because the proposer realizes that the responder will rationally maximize his own utility and will take any money offered.  This way the responder will leave with more money than he had before the game began.  The responder may lament the fact that the mere luck of the draw separates him from the proposer, but money is money, and free money is free money, and so he accepts.

When this game is run experimentally, the results are quite different.  The responder accepts the split only when it is close to 50-50, and often rejects when the offer strays to far from an equal split.  Furthermore, the proposer, without having the benefit of playing this game before, often offers a split close to the 50-50.  Why do both participants often behave unlike homo economicus?

Game_outcomes

In practice, the experiment is done with more care and in a double blind fashion, as explained by the Foundation for Teaching Economics’ lesson plan found here.  But the results remain the same.

  • The mean split is 60-40 (proposer gets 60% and responder 40%)
  • Most common split is 50-50
  • About 20% of the offers that fall outside the ‘fair’ range are rejected.

How does one explain the proposer’s generosity?  How does one understand why the responder ‘cuts off his nose to spite his face’ when the split is too low?  As discussed in great detail in the accompanying appendix to the lesson plan, this game has been applied in a variety of circumstances where variations in age, gender, background and other factors have been examined and controlled.  There appears to be no confounding variable that allows the administrator/experimenter to pre-determine when the participants will behave like homo economicus.  Even the amount of money has been varied. Relatively vast amounts were brought to the developing world, where people subsist on only a few dollars a day, and the results remained the same.

A much more cogent explanation is that the definition of rational self-interest needs to be expanded from the materialistic realm to consider things like reputation, human compassion and altruism, and wisdom.  And that these traits act to balance the purely materialistic instincts.

Virtue in the ancient world was defined not by a super-abundance of a trait but rather as the correct amount or a balance.  A warrior who acted reckless and drove into battle with an overly great amount of physical courage was no more lauded than the coward who sat in the corner timidly, wanting for danger to pass by.  The correct balance between caution and courage was the virtuous position.

Here in the ultimatum game, I see reflections of these ideas of virtue.  The game results provide ample evidence that a human being engaged in a free market does not necessarily become selfish.  The free exchange of goods and services is not inherently corrupting to those who participate, and they are no more likely to be preoccupied strictly with material possessions than if they had  not engaged. The free market, like any tool, can be misused and can create an injustice, but it is not intrinsically flawed.

Lord Acton is famously quoted as saying “All power tends to corrupt; absolutely power corrupts absolutely”.  I wonder what he would say about the Ultimatum Game. I’m not sure, but I like to believe that he would recognize the free marketplace as a place where people can come together to trade without the threat of coercion.

What Does the Fed Do Now?

Well, the January jobs reports are in and the economy created a reported 257 thousand jobs in January.  Hurray for the US economy!  This comes hard on the heels of job growth numbers for the November and December of 423 and 329 thousand, respectively.  The news is certainly welcome and the trend is encouraging, but not all of the results are likely pleasing to either the current administration or the American public at large.

The fly in this particular batch of ointment is that the unemployment number has ticked up one tenth of one percent.  Of course this is to be expected.  As I discussed in an earlier post, when consuming the job statistics, one has to make a sharp distinction between the unemployment rate and the workforce participation rate.  Some of the folk who had dropped out of the workforce entirely are now, no doubt, coming back in as job openings become available.

Indeed, Bloomberg’s lead article on the January numbers, entitled Jobs Report Crushes It, agrees with this idea saying that

A 257,000 January increase in employment capped the biggest three-month advance in 17 years and delivered the strongest wage gain since 2008, figures from the Labor Department showed Friday in Washington. The unemployment rate rose to 5.7 percent from 5.6 percent as the prospect of finding work lured hundreds of thousands into the labor force.


The article goes on to say that

Gains in purchases can trigger a virtuous circle of hiring and spending that will probably assure Federal Reserve policy makers that the expansion can withstand an increase in interest rates later this year.


And there is the rub.  The American people, by and large, do not understand the distinction between good and bad rises in the unemployment rate.  The public’s inability to make these distinctions is mostly due to the low economic literacy and discourse of many of the institutions that proclaim themselves as the guardians of the working man.  Primary amongst these are the media, who gush and dance in sound bite and spin, about any ‘favorable’ movement in an indicator whether or not it is actually good.  Also culpable are the schools, which employ teachers less economically literate than my butcher.  After all, public school teachers don’t have to worry about producing a product the public wants since the government will make sure the bills get paid and the lights stay on no matter how many students show up.  My butcher, on the other hand, needs to show just where the beef is.

So, the public is likely to get restless as the unemployment rate rises.  As public sentiment goes, so goes the administration, which will likely leverage political pressure of the Federal Reserve to lower unemployment.

For those who don’t know, the Federal Reserve (or the Fed, as it is affectionately known by everyone – even themselves) is charged with control of the monetary policy of the United States.  As the nation’s central bank, it has only three arrows in its quiver:

  • Open Market Operations – buying or selling of bonds to basically create or delete money from the economy. Buying bonds will increase the money available in the economy and selling decreases it.
  • Reserve Requirements – sets the percentage of deposits that a bank must hold in reserve. Lowering the reserve requirement frees up more money to be loaned and raising the reserves limits the amount.
  • Discount Rate – fixes the interest of a loan from the Fed to a bank.


The effect of each of these is to raise or lower the interest rate that banks charge each other for bank-to-bank loans (federal funds rate), which then trickles down to the end consumer as the rate to borrow.  These three arrows are shot at two distinct targets with the intent of keeping inflation fairly constant at about 2% per year and keeping unemployment also fairly constant at about 5% per year.

The Fed has even gone to the trouble of creating a web-based video game in which the player can pretend to be the Fed Chairman.  The rules of the game are succinctly summarized when you are appointed chairman and are now in charge.

Fed_game_rules

The simulation, while visually appealing, is primitive in its fidelity and doesn’t inform the player what model is used to determine how the simulated economy will respond to the changes he makes.  But considering that this is meant to be an educational tool, my guess is that the rules are really simplistic.  The following snap shows one of my attempts at managing the economy.

Fed_game_economic_crisis

I suppose the Fed’s intent is to make it clear how hard it is to do their job and, perhaps, have us show a little gratitude for their steering an ocean liner successfully through troubled waters.

And maybe I should be grateful, but I can’t help but think that the Fed can’t possibly do a credible job of controlling inflation and unemployment by essentially adjusting the federal funds rate.  This particular jobs report is a perfect case in point.  One of the rules of the game states that ‘you can lower unemployment for a while and push up inflation by setting the federal funds rate close to, or even below, the inflation rate.’  That rule can only be true if something else, say the workforce participation rate, remains constant.

In this particular case, keeping the federal funds rate low, as it currently is, is actually raising the unemployment rate, and that is a good thing.  Capable people who had fled the workforce need to come back in and swell the ranks, even if they are just looking for jobs at this point.  It also isn’t a given that inflation needs to rise as these workers find jobs and begin to gather paychecks.  That point of view only makes sense if one only assumes that the output of goods and services remains low so that ‘more money is chasing few goods’.  But the recent decline in gasoline prices that has pushed inflation down (at least in practical if not statistical terms) is due to the industry of workers flooding into the energy sector.

So, what does the Fed do?  I suspect that they will coax the federal funds rate to rise and that, in the process, they will smother what is a good thing.  I mean, what else can they do when they are trying to achieve fine control using the crudest of tools?

Turning an Old Saying on its Head

Time is money. From our earliest years to the twilight of our lives, each of us hears that sentence over and over again. It slides across the page in print and pounds our ears in radio, film, and television. It’s usually uttered by some ruthless wolf of Wall Street or miserly business man with no heart. It’s a cruel phrase that weighs profit in one hand and people in the other and finds the human side of the equation wanting. It’s the proverbial elephant in the room that we fervently wish to be false but fear is true – that the almighty dollar rules our life, exactly as we are warned in that classic song by the O’Jays (and as brillantly portrayed in the opening sequence of the movie For Richer or Poorer).

But how many of us really understand what that sentence is all about? Is money really the evil necessity that prevailing wisdom warns us about? How might our attitude towards money be different if we simply turned that old trope around to read: Money is time?

Let’s start our discussion of what money really is by looking at its origin. It’s common knowledge that, prior to the invention of currency, bartering was the only way of trading goods and services. We've all learned that in school (at least we should have), and there is that Schoolhouse Rock song

that tries to explain how money arose from the bartering system. The song is catchy but its message is muddled. Money wasn't invented to make it easier to carry goods around or to make change. It was invented to save the most precious commodity a human has: his time.

Living with currency of all sorts (paper and electronic) makes it easy to ignore just how time consuming barter must have been. A typical scenario might have looked just like this. Let’s suppose that Charlie lives in an agrarian society where there is division of labor but no currency. Charlie raises chickens and since he can concentrate on their breeding and rearing, he can produce far more chickens in a unit of time than he could if he didn’t specialize. Having more chickens than he needs, he is willing to trade some of his for sheep that his neighbor Steve breeds. He is also willing to trade with Pam for some of her pigs or William for some of his wood but not with Fran or Harry since Charlie dislikes fish and has no use for hay.

Problems arise when Charlie wants pigs but Pam is unwilling to trade because she wants hay. Unfortunately, Harry won’t trade with her because he wants sheep. Steve, however, doesn’t want hay because he needs wood to fix his house. Steve’s willing to trade with William, but William has his mind on the nice fish tacos he could make if only he had some fish. Fran won’t trade with William, even after William has offered his finest oak lumber, because Fran is dreaming of a nice chicken sandwich but is lacking the main ingredient. By visiting each in turn, Charlie is able to piece together a plan of action, and he proceeds to make four transactions that he doesn't want to make, to finally arrive at the one he does. First he trades chicken to Fran in return for fish. Next he takes the newly acquired fish and gives them to William in exchange for some nice wood. And so on. The figure below shows the whole wacky scheme.

Charlie_in_the_middle

Charlie not only has to spend his time moving goods around this vicious circle but he also needs to spend time learning enough about all the other goods so that he knows how much his chickens are worth relative to them. Failure to know what his chickens are worth will prevent him from bringing home the bacon and, instead, will cause them to come home to roost.

Many of us don’t relate to farming unless we are playing Harvest Moon or Farmville. Fortunately for us, this idea of horse trading from A to B to C and so on is kept alive in sitcoms. My fondest memory of this kind of show is the episode of M*A*S*H entitled ‘For Want of a Boot’ in which Hawkeye tries to get a new boot by making a chain of transactions. Of course, it blows up in his face just as he’s about to achieve his goal, as the last person reneges, setting off a chain reaction that sets him back at square one with only a long useless day to show for his efforts.

Obviously, Charlie's situation would be greatly improved if there were a central entity with whom everyone could transact business and who also knew the relative worth of each person’s goods. Fortunately for our little farming village, money is such an entity.

The invention of currency allows for a single transaction between each seller and buyer, saving a lot of time. The market where the money and goods are exchanged provides the framework for determining the relative worth of each good.

Money_in_the_middle

The adoption of currency also allows our little group to preserve the worth of their goods in a non-perishable form. Fish may spoil and wood may rot. The chickens may die and the sheep grow old. The hay may get moldy and the pigs may get skinny. But the value of each good is secure once it is traded for currency. Money also allows for the expansion or contraction of the economy when a new member arrives (Tim with his tools) or an existing member leaves (Steve and his sheep head to greener pastures).

To summarize these benefits, we say that money:

  1. Acts as a medium of exchange
  2. Sets relative worth via the prices paid for each good
  3. Holds the value for future use.

In all of these benefits, the aim is to provide more time for everyone involved to live life and enjoy. So, the next time you see Time is Money and you cringe, turn that expression on its head and remind yourself that the correct way to read that is Money is Time and that it is time that really counts.

Regular Maintenance

See if you recognize this typical scene, played out from time to time in workplaces all around the country.  One of your co-workers is late coming to work.  Upon his arrival, he meets the office’s quizzical looks with a verbal response that amounts to something like “Yeah!  My car had problems this morning.  I think I need a new…”.  I am willing to bet that most everyone has been on both the giving and receiving end of this exchange.

The next segment in the exchange goes something like this.  Everyone gathers around and discusses the problem.  Opinions fly as to what is exactly wrong, how much to pay, where the best place is to go to get the repairs done, and how to make sure that the mechanic doesn’t cheat.  Typically, there is a lot of varying ideas about the specifics.  “Take it to the dealer”, says one.  “No! don’t go to the dealer.  I know a guy.”, responds another.  “Check the internet first”, comes yet another bit of advice, and so on.  But there are really no differences in the general goal.  Everyone involved is trying to find the best value, the best repair relative to the price.  And every one of them is engaged and has knowledge that can be put to use.

Let’s be specific and consider the case where you need a new set of brakes for your Honda Civic.  A simple internet search with the search string ‘new brakes cost honda civic’ returns as one of the top hits a link to Civic Forums, where the same type of dialog happens in the medium of the chat forum.  For this particular repair, the generally agreed upon estimate of the cost is $150.

Also note that no one suggests that the owner file a claim with their car insurance.  No one even entertains the notion, since replacing the brakes is part of the regular maintenance on a car.  Everyone recognizes that car insurance is meant to hedge the risk of an accident that damages life, limb, and property.  Most people go through life hoping that they never have to draw on their car insurance policy.

Now consider another type of regular maintenance – maintenance of the human body.  The comparison between this activity and the situation described above is quite stark in the differences.

To begin, our natural shyness about the body tends to dissuade us from talking about the standard types of treatments we all need.  Few have the same enthusiasm for discussing trips to the doctor with their co-workers as they do trips to their mechanics.  But wait, you say, here is where the internet comes into play.  A person can set up an avatar, assume a cyber-identity, and maintain his personal dignity while getting answers to some of the more delicate questions that can be posed.  And this is absolutely true.  One need only surf the World Wide Web for a while to see that people are quite willing to discuss (and display) just about any matter concerning their body with the mask of anonymity that a computer account affords.

So then, why is there so very little general knowledge about how much various medical treatments will cost?  And what questions should be asked?  And so on.  As a society, we know far more about how to be informed and savvy consumers in almost every other market that is out there, and yet we are total dunces when it comes to the medical markets.

Again to be concrete, let’s look at a specific medical maintenance issue.  Suppose you’re now of the age where your doctor wants you to get a regular colonoscopy.  Where do you go?  How much should you pay?  How good is the doctor and how much risk is involved?  All of these are valid questions, but I am willing to bet that very few know meaningful answers.  Let’s take a look at the first two questions in detail.

A simple internet search with the search string ‘colonoscopy cost’ returns as one of the top hits an article in The Health Care Blog entitled ‘How Much is My Colonoscopy Going to Cost? $600? $5400?’ by Jeanne Pinder.  As the title suggests, there is a vast range in the costs of a colonoscopy ranging, according their research, from $600 to $5400, a factor increase of 9 from the lowest value to the highest value.

Pinder lists six items in the total cost that should be examined before committing to the procedure.  These are:

  • Doctor’s fee
  • Anesthesiology cost
  • Lab Tests
  • Facility Fees
  • Pre-procedure consultation
  • Preparatory costs, including medications required for the procedure

However, Pinder points out that it is difficult to get straight answers for most of these items.  The doctor, anesthesiologist, lab, and facility all bill separately.  All play the shell game between listing the charged price and the paid price.  The charged price seems to be the cost that these service-providers initially ask, while the paid price is what they settle on once the haggling with the insurance company is completed.  Having so many moving parts also makes it easy for each group to avoid accountability and, indeed, their usual response, as cited in the article, is “we don’t quote prices in advance.”  Imagine going to your mechanic and being told something to the effect “we’ll let you know how much it costs when we figure it out” – you would never put up with it.

Recently I discussed the stark contrast between regular maintenance for a car and for a boy with a co-worker.  He raised the objection “do you really want to have a procedure performed by the lowest bidder?’  On the surface this may seem like a cogent argument but some reflection shows that it is inadequate.

What logical connection is there between paying more and getting better health care?  There is some truth in the old maxim “you get what you pay for”, but that really only applies to situations where the consumer is trying to get a ‘sweet deal’ by cutting corners. This maxim is utterly devoid of meaning when the consumer knows next to nothing about the goods or services he’s buying.  Perhaps a doctor who charges more for his services may be worth it.  On the other hand, he may be a shady character who talks a good game, gives poor or even dangerous service, and is putting his profits before the patient’s needs.   He may have to charge high prices to cover his malpractice claims and you just don’t know it.  It is also possible that a good doctor is one who possesses enough skill that he can diagnose your problem without groping through unnecessary and costly tests which consume your time and put you through needless pain (both physically and mentally).

There is a related objection that asks why would you want to skimp when it come to your health.  This objection is also patently fallacious.  My health depends intimately on a day-to-day basis on the condition of my brakes and tires but that doesn’t stop me from seeking the best price. By seeking the best price, I am actually conserving my resources for other things that also have a positive impact on my health, like going to the gym, or buying better food, or moving to a better neighborhood.   The word ‘skimp’ is merely a red herring that is meant to stop us from realizing that purchasing medical services is done, like every other purchase in life, in a market.

The short of it is that when it comes to car, home, or appliance maintenance, each of us is reasonably knowledgeable in the marketplace.  Each of us tries to find the best value and each of us understands what insurance covers and why.  In the medical market, few if any of us have enough knowledge or enough courage to seek the best value and to understand what the role of insurance should be.  We trust that doctors and hospital and medical practitioners will protect our interests in a way that we don’t trust mechanics.  But this trust is predicated on nothing more than the fairy tales we’ve been told on television and in the movies.  Until each of us takes responsibility for being informed health consumers the system will remain in critical condition.

How Kodak Went So Wrong

On more than one occasion I’ve visited Eastman House in Rochester NY.  Situated in the south-east section of the city, the house which Kodak founder George Eastman built stands on a beautiful tree-lined street which is particularly delightful to visit in the fall.  Entry to the house occurs in the side furthest from the road and the visitor finds himself passing through the International Museum of Photography and Film before coming to the house proper.

Exhibits of cameras and photographs, famous and unknown, fill the halls and line the walls of the museum, emphasizing and re-emphasizing the revolution that George Eastman’s innovations played in the development of the modern world.  After all, Eastman’s products shaped society and helped birth such modern day fixtures as motion pictures, photo journalism, scientific imaging and the like.  They also netted Eastman a vast fortune.

His house, which lies just beyond the museum, is a grand mansion in the true captain-of-industry style, worthy of the money he earned in his lifetime.  Eastman was so wealthy that he was actually able to have the house enlarged by having it cut down the middle, separating the pieces by several feet and then having the gap subsequently filled in and decorated.  The first floor of the house is preserved essentially in the style and furnishings of its owner at the time of his death.  On the second floor, however, some of the rooms have been turned into multimedia exhibits where the visitor may learn more about the man and the vision that netted him his wealth.

George Eastman, was born in 1854 to what could be called an upper-middle class family.  His father, George Washington Eastman, had started a business school in the early 1840s, but the family fortunes took a steep downturn shortly after George’s birth when his father took ill.  The family moved to Rochester in 1860, just two years before the father’s death from a brain disorder.

George eventually left his schooling behind and went to work as a bank teller to raise money to support his mother and himself.  Extremely dissatisfied with his experiences with professional photographers of the day, Eastman spent his spare time tinkering with the chemical processes underlying the capture of a photographic still.  From 1880 to 1884, he successfully filed for 3 patents for new ways of applying photographic emulsions and the invention of photographic film.  Four years later, he invented the first camera designed to use the film.  Four years after that (1892) he founded the Eastman Kodak company, which enabled him to earn vast sums of money, positively affect the lives of his employees and the people of Rochester, and to donate over 100 million dollars to various institutions of higher learning here in the United States and abroad.  His invention of film earned him the Gold Medal of the American Institute of Chemists in 1930.  He died of a self-inflicted wound two years later, in 1932.

It is easy to look on George Eastman’s life, his wealth and fame, his philanthropy and public works, and miss the one main ingredient that led to his success.  It was the simple business idea that people would want to take photos for themselves.  His innovations, especially the Brownie, were means to the end of bringing photography out of the hands of the experts and putting into the hands of anybody with an enthusiasm for capturing an image, documenting a memory, or making a piece of art. That’s how George succeeded.  And, unfortunately, it was the loss of that idea that led Kodak to fail.

When Eastman was at the helm, Kodak reflected his innovative spirit and his desire to put people first.  The company was unafraid to try new things, such as a 13-month accounting year or a 40 hour work week, not because they wanted to be seen innovating nor because it was shiny and new, but because they cared about people.

After his death, Kodak began a strange trajectory in the business world. From the 1930s to the 1990s, Kodak ruled the landscape of film photography, with the company commanding 90% of film sales and 85% of camera sales as late as 1976.  The constant revenue supply fueled a research development engine that generated many inventions.  Some of the most notable are:

  • Invention of the tunable dye laser (1970)
  • Invention of the digital camera (1975)
  • Development of the Bayer filter for digital color photos (1976)
  • Launch of the first megapixel camera (1986)

Nonetheless, the same time frame saw a huge number of missteps.  Kodak assumed that its customer base would remain loyal under the encroachment of Fuji Film in the later 1970s and early 1980s.  During the 1990s and early 2000s, the corporate motif was one of mergers and acquisition, and subsequent divestitures of same, sales of intellectual property, stock issues, seemingly endless branding and re-branding.  All of this finally culminated with Kodak filing for Chapter 11 bankruptcy protection on January 19, 2012.

Having emerged from bankruptcy, Kodak now says that it:

has transformed itself into a technology company focused on imaging for business. Today's Kodak provides:

  • World-class R&D, based on Kodak's unique strengths in the materials, imaging and deposition sciences
  • Breakthrough products enabling customers to achieve transformational improvements in quality, productivity and sustainability
  • A broad solution set across graphic communications, product goods packaging, functional printing enabling
  • Software and professional services businesses use to redefine information flow and security


In an interesting take on Kodak’s bankruptcy, How Kodak Squandered Every Single Digital Opportunity It Had, Pete Pachal notes that

But Kodak's inability to make any of its products stand out over the last decade is demonstrative of an overall reluctance to innovate. Certainly, if you asked Kodak executives in the early 2000s if they were committed to innovation, they would have answered yes, but real innovation requires risk and vision. You don't kill all Wi-Fi cameras just because the first model got a lukewarm response from the market — that is, if you really believe in the core idea.


I think that Pachal is close to the mark in his criticism but that he misses the final point.  It isn’t innovation that matters but a clear focus on ‘the what’ of your business not ‘the how’.  Eastman clearly understood this distinction, since his moves were always a means to an end.  Development of film was the method to bring photography to everyone.  The Kodak and Brownie cameras were not innovations for the sake of being committed to innovation but rather a service being provided by Eastman to people everywhere.

During the years between Eastman’s death and filing for Chapter 11, we saw a lot of bumbling and stumbling from a culture inculcated during Kodak’s dominance; a culture focused on how to do things not what to do.  We saw research and development done for its own sake, because that’s how a company stays on top.  We saw companies being drawn into and spun off of the central corporate structure because that’s how a powerful business operates.  We saw a slavish devotion to film because that’s how Kodak made their money.

That’s why it wouldn’t have mattered if Kodak had stayed with WiFi for photo-sharing, or if had embraced something else that was innovative.  Rather, if the company had stayed focused on the human element, they would have continued to grow digital photography and they would have invented WiFi, cloud computing technology, and no doubt launched their own kind of Instagram.  Not because it was how to succeed but because it was what people would have wanted.  This Kodak would have known when to throw away old ideas in favor of new, and would have stayed ahead of the curve because this Kodak would have thought just like the customers they serve.

As a result, I would argue that the new Kodak is in no better position to succeed than the old Kodak before it emerged from Chapter 11 protection.  Not because the new Kodak has picked the wrong core competencies or is focused on the wrong market segment, but because the new Kodak shows no indications that it is focused on service.  It may stay in business, but it will never thrive again until the company is run by people with a vision like George Eastman's; people who know what the customer wants.

If George Eastman were alive today he would be profoundly disappointed.

Gini in the Bottle

For many years, the debate about income inequality has seemed to me to behave like some of my more primitive attempts at cooking.  For a while it simmers, warranting almost no attention and sitting there like the proverbial watched pot with nothing happening.  Then, as some political burner turns up the heat, it boils over into something messy like the Occupy movement, suddenly demanding damage control and cleanup.   And much like my aborted attempts at food preparation, neither of these situations ends up leading to anything satisfying.

As a result, my interest in the income inequality debate falls into the same place in my mind as does my interest in the culinary arts – a dusty corner where I vaguely recognize that people are passionate about it, but where I reason that I’ve nothing to contribute to it and it has nothing to contribute to me.  And, so, I basically tuned it out.  This situation has thawed for me this past week (forgive what will be the last food analogy) with the publication of an intriguing nugget in an article from the Washington Post.

In this article, entitled ‘Income Inequality – the issue the Democrats want’, Ed Rogers rails against what he paints as the Democrat hypocrisy.  The point that Rogers tries to make is that the Democrats don’t want to address income inequality; they simply want to use it as a political tool to separate their message from the Republican one.  He may be correct – I don’t know – but, just as I was going to stop reading at the end of the third paragraph, he posed the question ‘What exactly is “income inequality”?’ This grabbed my attention, and I found out that income inequality is measured by something called a Gini Coefficient.  Suddenly, there was a possibility of real data and actual statistical analysis, and I got excited.  Rogers also cites, as strong support for his contention, an article in the New York Times entitled Is Life Better in America’s Red States?  This article by Richard Florida presents a chart of Gini coefficients, calculated by state, which shows that the majority of the worst 21 states in terms of income inequality in 2012 are in blue or purple states, compared with the majority being red in states in 1979.  Suddenly there was actual tabulated data showing a before and after situation.

I then went off to try to understand the Gini Coefficient, which, in a nutshell, is based on something called a Lorenz Curve.   Resolving to go only one more turtle down, I then set myself to understand the Lorenz curve.  Fortunately a Lorenz curve is relatively easy to understand.

The whole machine starts with a table of income distributions.  The simplest presentation I’ve found is from Timothy Taylor’s book Principle of Economics: Economics and the Economy, 2nd edition.  Start by dividing the existing population into quintiles, and then measure the income that each quintile receives for a given year.  For example, in the years 1967 (the first year measured in the US), 1985, and 2005, the income distribution looks like

Percentage Income Distribution
Quintile 1967 1985 2005
1st 4.0 3.9 3.4
2nd 10.8 9.8 8.6
3rd 17.4 16.3 14.6
4th 24.2 24.4 23.0
5th 43.6 45.6 50.4

From the table, one can tell that, in 1967, the bottom 20 percent of the population received 4.0 percent of the income, and that this percentage fell to 3.4 percent by the year 2005.  Likewise, the middle 20 percent also saw a drop in their share of the income from 17.4 percent to 14.6 over the same time span.

The next step is to construct the cumulative income by partially summing down the column.  The corresponding data looks like

Cumulative Percentage of Income
Population Percentage 1967 1985 2005
0 0 0 0
20 4.0 3.9 3.4
40 14.8 13.7 12.0
60 32.2 30 26.6
80 56.4 54.4 49.6
100 100 100 100

with the obvious boundary conditions that zero percent of the population receives zero percent of the income and 100 percent of the population receives 100 percent of the income.  The addition of the 0-line will be needed in the next step.  Note carefully how the value at, say, 40 percent of the population is the sum of the 1st and 2nd quintiles, while the value at 60 is the sum of the first 3 quintiles.   The graph of these values then gives the Lorenz Curve as shown below

Lorenz_curve

Calculation of the Gini Coefficient is a bit more involved, and requires two new Lorenz curves and a modest amount of computation.  The first curve, called hereafter the ‘perfect curve’, represents a perfectly balanced society with equal income distribution over all segments of its population.  The resulting income distribution and cumulative percentage of income are

Percentage Income Distribution Population Percentage Cumulative Percentage of Income
perfect
Quintile 1st 20 20 20
2nd 20 40 40
3rd 20 60 60
4th 20 80 80
5th 20 100 100

The second curve, called the ‘imperfect curve’, represents the income distribution of a completely unbalanced society, with only one member receiving all of the income and every other member receiving nothing.

With all the ingredients now in place, the Gini Coefficient is then defined as the ratio of the area between the perfect curve and a given Lorenz curve to the area between the perfect and imperfect curves.  As a formula, if A is the area between the perfect curve and a given Lorenz curve and B the area between a given Lorenz curve and the imperfect curve, then the Gini Coefficient, denoted as G, is given by G = A/(A+B).  This is shown in the figure below with the Lorenz curve given for a linear distribution of income (first quintile has 6.7 percent; the second quintile has 13.3 percent, etc.).

Lorenz_curve_annotated

The area between the perfect curve and the given Lorenz curve is most easily calculated by calculating the area beneath the given Lorenz curve (B) and subtracting it from the total area beneath the perfect curve (A+B), since the latter has the known value of 0.5.  The easiest way to see this fact is to convert the y-axis (cumulative percentage of income) to fractions by dividing by 100.  The perfect curve is now a 45-degree diagonal in the unit square with the area of the triangle enclosed by it, and the imperfect curve being one half. The resulting expression for the Gini Coefficient is then A/(A+B) = (A+B-B)/(A+B) = 1-2B.

So, the computation of the Gini Coefficient comes down to computing the area B by integration.  For a mathematically specified distribution, the functional form of the Lorenz curve is known, and the area can be carried out using calculus.  For example, the linear distribution curve results in the functional form of the Lorenz curve of x2, where x is the population fraction.  Note that the linear curve, when partially summed, must be normalized, thus its Lorenz curve is x2 not x2/2.  The integral of x2 is x3/3, which, when evaluated on the interval [0,1], gives B = 1/3 and G = 1-2B = 1-2/3 = 1/3.

For empirical distributions, such as listed above for the years 1967, 1985, and 2005, a numerical approximation to the area under the Lorenz curve can be estimated in a variety of ways.  To illustrate, I chose the particularly simple approach of using the trapezoidal rule.  The resulting Gini coefficients are then

Year Gini Coefficient
1967 0.370
1985 0.392
2005 0.434

Clearly, there is a growing trend towards greater income inequality, but what to make of it?

First, it is important to remember that the Gini Coefficient doesn’t measure poverty.  Everyone in a population can be rich and the Gini Coefficient could indicate an income distribution far from the perfect curve (think of football players and owners).  Likewise, everyone in a population can be poor and the Gini Coefficient could indicate an income distribution near the perfect curve (think of a native tribe in the Amazon like the Yanomama) .

Second, to quote Taylor:

No society should expect or desire complete equality of income at a given point in time, for a number of reasons.  First, most workers receive relatively low earnings in their first few jobs, higher earnings as they reach middle age, and then lower earnings after retirement.  Second, people’s preferences and desires differ.  Some are willing to work long hours to have large income…Others will work fewer hours…  Third, people can be lucky or unlucky. Some decades ago, an economist named Henry Simmons tried to find an objective, scientific way to determine how much inequality was appropriate.  After a great deal of thought, he decided that the question had no answer.


Okay, so it seems that income inequality is a fixture of life, but is there any way to understand the observed trends?  I will point out that trends in income inequality are cited by Taylor to be predominantly due to two effects.

The first is a demographic shift amongst the higher income earners, in which they have been preferentially marrying each other (e.g., a lawyer with a lawyer), thereby concentrating more income in the top earners.  This is to be contrasted with an older model in which a high income earner (e.g., a doctor) tended to marry a low income earner (e.g., a school teacher).  I would argue that this change reflects an underlying improvement in American society and the upward mobility of women.

The second effect is as discouraging as the first is encouraging.  There is an educational gap between the highly skilled worker and the low or unskilled component of society, and it seems to be widening, not shrinking.  Highly skilled workers are in high demand due to the technological advances over the past 30 years, and as more of them enter the marketplace, the pace of technological development and the need for more advanced training increases.  This problem is further exacerbated by the fact that lower income families not only have fewer good educational opportunities, but they also tend, more often than their rich counterparts, to be comprised of a single parent, which creates a substantial educational disadvantage.

Free Electric Riders

In previous posts, I discussed the concept of the free rider and the harm that such a member of society can do to a common good.  In this post, with a decidedly impish tone, I identify the growing number of free riders and the related villains that I will call cheap riders, and how they are harming our road and highway infrastructure.  And with a more serious air, I will suggest what can be done.

Who are these societal ne’er-do-wells?  In what grimy back alley can we find them?  How many of them are there, and why aren’t the police cracking down?  Well, we need go no further than our own neighborhoods. Look around your street or at your work.  Find those among us who own and drive electric cars and you will find these despicable free riders.  Seek out those of us with fuel-efficient hybrids and you’ve found the cheap riders who are also not contributing their fair share.  Look for those of us that eschew car ownership completely but expect the advantages of mobile society, and you’ll have discovered a different kind of rogue.  Ranking the villainy of each of these groups is difficult, as men of good conscience can agree to interpret the same facts differently.  I judge the weight of their societal blight based on a combination of sheer numbers and on overall the snarkiness of their mindset.

Now, before a group of traditional internal-combustion enthusiasts band together to form a flash mob that begins to tar and feather these more ecologically-minded (or, in the case of the Tesla, more futuristically-minded) of us, consider that it isn’t their fault.  To paraphrase Shakespeare’s Julius Caesar (Act 1, Scene 2), the fault, dear reader, lies not in our stars, but in our poor understanding of economics.

The generally understood and designed way of supporting our roads was constructed in the days of yore to be a per-gallon tax on gasoline or diesel.  The idea here is that ‘those that drive on it will be those that pay for it’.  A fine sentiment that may have made sense back in the day when June Cleaver and her immaculate dress and fine pearls roamed the Cleaver household cleaning and cooking, but which now seems dated and stupid in these more enlightened days of electronic everything.

Consider first that marvel of modern engineering, the Tesla.  A fully electric car, the Tesla neither consumes a drop of gasoline nor does it emit a molecule of exhaust gas from the combustion of a fossil fuel.  Stealthy and silent, you can’t hear it come upon you, nor can you hear the damage it does to the roads upon which it travels.  Nonetheless, its passage on the roads does do damage, both in the physical and in the economical sense.  The Tesla driver is able to take advantage of the roads without paying for their upkeep, effectively circumventing the ‘those that drive on it are those that pay for it’ maxim.  And to heap insult on injury, many places, such as the progressively-minded University of Maryland, provide free parking and free charging to these scofflaws.

This guilt is equally borne by those who have plunked down far less money to own a Leaf or a Volt or whatever other kind of electric car is out there.  In all these cases, the tragedy of the commons is occurring before our very eyes, and, rather than scream in outrage, we applaud the perpetrators' contribution to society.

Nissan_leaf

Closely behind this no-emissions crowd, is the more sinister hybrid owner, who makes up in volume what he lacks in technology.  Exemplified by the ubiquitous driver of the Toyota Prius, he seems to be, on the surface of it, a nice enough kind of guy.  He drives to the same markets you do, you pass him on the road to work every day, and you both buy your gas at the same stations.  It is his ability to blend in that tricks you into missing the inestimable harm he is causing to our roads.  Found in far greater numbers than his all-electric brethren, he puts large numbers of road-bashing miles on our nation’s bridges and boulevards while paying a minimal amount of gasoline tax for the ‘privilege’.

Some numbers should help to put this dire situation into clearer focus.  Take a side-by-side comparison between the Toyota Prius and the Ford Fiesta, both vehicles being similarly-sized offerings in the small car category.   The Prius tips the scales with a curb weight of 3072 lbs compared with the Fiesta’s slightly lighter 2537 lbs.  Assuming a 60-40 split between city and highway driving, the Prius’s effective gas mileage is 49.8 mpg compared with the Fiesta’s effective 35.8 mpg.  The implication here is clear.  The Prius delivers 20% more pounding to the road (3072/2537) than the Fiesta does, while paying 40% less for the upkeep (49.8/35.8).

But no demographic is as sinister as the car-less.  These people would pass themselves off as being above the fray – free from the mad obsession with driving from hither to thither.  After all, why can’t people live where they can bike to work, or walk to the market. This holier-than-thou attitude blinds them to the fact that all of their basic services and creature comforts come from the nation’s roads.  How else does the organic food they eat make it to market?  How do the products they consume, the electricity that they use, the medical services they pine for come to their locale without the infrastructure used by the driving crowd?

So, the answer to the problem of these free and cheap riders seems to me to be quite clear.  All of us have a vested in interest in the common good that is the nation’s highways and byways.  Just like public schooling or national defense or police and fire services, the roads are a common good that works for all and that should be paid for by all.  The idea that only ‘those that drive should be those that pay’ is ridiculous and should be met with as much scorn as is heaped upon those that say “I don’t have any children; why should I pay for schools”.  All of us should help to bear the burden of the upkeep of the national and local transportation infrastructure.  That isn't to say that we should abandon the idea of the tax being scaled by usage that underlies the gasoline and diesel tax.  But we should move the tax towards one where everyone pays a flat base rate for general upkeep, and then additional taxes are collected based on mileage.  This way, everyone has skin in the game.

The Simple Facts about Unemployment

Many of my friends and co-workers don’t understand my concern about employment in this country.  The unemployment rate has, after all, fallen from a peak of 10% in October of 2009 to the current value of 5.8% in November of 2014 (data from the Bureau of Labor Statistics).  So, as the argument goes, what’s my problem?

Well, as I try to point out, the unemployment rate really doesn’t tell the whole story.  It is only one measure of the health of the labor market, and not necessarily a good one.  When there is a lot of economic growth, as in the eighties and nineties, the unemployment rate is a reasonable measure of the health of the work force.  When the labor market is experiencing the type of new normal that the country is currently mired in, it is a poor measure indeed.

The reason for this is that the unemployment rate measures the percentage of workers who are in the work force and are actively looking for jobs but unable to be employed to the total population in the work force.  What the unemployment rate doesn’t measure is the size of the work force relative to the population of the country as a whole.

This definition of the unemployment rate appears in both textual and mathematical form in countless articles and texts dealing with employment and the labor market.  So does the caveat about the work force participation.  However, I don’t know of a single place that illustrates these distinctions in an easy to calculate, visual form, and so I decided to supply one of my very own.

For the sake of this illustration, I am going to assume a static population, a snapshot if you will, and I am simply going to calculate percentages based on a visual representation of various components of the population.  Also for simplicity, our population will be divided into four demographics:  minors, college age, working age, and retired.  The definitions for these four demographics are:

Demographic Definition
minors The portion of the population too young to hold a job in the economy.
college age The portion of the population that is old enough to hold a job but who may choose to opt out to attend higher education.
working age The portion of the population that is past the age to attend higher education and is in its prime working years.
retired The portion of the population that is past the age where it is allowed to work.


Obviously these demographics represent a gross simplification of the actual population.  There are never as cleanly drawn lines in the real case as there are in this ideal case.  But to illustrate the point, these are close enough to make a good model for the economy and an easy model to understand the labor market.  I’ll talk a little more about the complications after the basic model has been developed.

Let’s start with the ideal world shown here

Ideal_world_employment

Those members of the population that hold jobs in the economy are colored green while those members who are not in the work force are in gray.  It is worth taking a moment to talk about what it means to be in the work force.  Clearly the minors and retired demographics are not in the work force because they are not allowed to hold a job.  All the members of the working age demographic have a job and so they are obviously in the work force.  The only group that requires some thought is the college age demographic.  In this ideal world this demographic is exactly split in half with two members opting into the work force and two opting to pursue higher education.   With 24 total members of the population and 18 workers in the work force, the work force participation is 18/24*100 = 64.2%.  The unemployment rate is zero since everyone in the work force is working.

Now let’s introduce some economic realism and assume that not everyone who is in the work force can actually find a job.  This more realistic world looks like

real_world_employment

where the members of our population who want a job but are unable to find one are now colored red.  In this scenario, two workers from the working age demographic and one worker from the college age demographic are now out of a job.  The number of workers in the work force has remained unchanged at 18, and so too has the work force participation, but the unemployment rate, which is a measure of the percentage of the work force without a job, has risen from zero to 15/18*100 = 16.7%.

Finally imagine that the college age worker has decided enough is enough and he heads back to an institution of higher learning, and that one of the unemployed working age guys decides to stay home and play video games all day long.   These two members of the population have now exited the work force (colored gray with red trim to remind us that they were once in the work force), which shrinks from 18 to 16.

shrinking_work_force_employment

The one remaining unemployed working age guy keeps at it but is still unable to find a job, and the unemployment rate shrinks to 1/16*100 = 6.2%, reflecting only his frustration in not finding a job.  The work force participation now falls to 16/28*100 = 57.1%.

Clearly the population as a whole is no better off with this lower unemployment rate than it was with the earlier case with high unemployment.  In both cases, the number of employed workers in the population remains the same at 15.  These 15 are now charged with producing the goods and services that will be consumed by all 28 members.

So, does this model actually represent reality?  The unfortunate answer is yes.  While the unemployment rate has fallen, so has the work force participation.  Statistics pulled from the Bureau of Labor statistics for both the unemployment and work force participation rates result in

BLS_USA_statistics_12_14_2014

Of course, the US population is not static like the model problem discussed above, so maybe there is some way to reconcile a shrinking unemployment rate with a diminishing work force participation without having to conclude that there is trouble.  Also, what about all this news that says that hundreds of thousands of jobs have been created each month?

The population of the United States was growing annually at about 0.7% in calendar 2013, which is the lowest rate since the Great Depression.  Assume a base population of 300 million, which is a lower bound well below the actual value of approximately 317 million.  The number of new births each month in 2013 was 175,000.  Now assume that somehow this birth rate, in absolute terms, remained the same in perpetuity – that is to say that 2.1 million children would be born each year.  This scenario is clearly unrealistic since the growth rate is measured relative to a growing population, so to achieve this scenario we would have to have ever falling population growth rates.  In fifty years of such a growth model, the population would increase from 300 million to 402.9 million with the growth rate decreasing from 0.70% to 0.52%.  Note that this model also assumes that everyone lives to retirement.  Finally, assume that the country as a whole is content with a 62.5% work force participation rate.

None of these assumptions are realistic let alone likely, but by making them, we can calculate a lower limit on the number of new jobs needed each month just to keep the status quo.  That number, of course, is 175,000 new jobs per month to match the birth rate.  Now we can compare the actual job growth seen in the country over the time span from 2007 (the time when the country actually had about 300 million in it) to today against this 175K target.

Over this time span, a net 2.835 million jobs were created according to the BLS job creation numbers.  That’s it! Barely enough jobs were created in 7 years to cover about 1 and 1/3 years of population growth in the anemic model discussed above, and probably not even a full year under realistic population growth.  In order to get back to work force participation levels close to where we were in 2006, the last year where job growth approximately matched population growth, the country as whole would have to produce at least 14.7 million extra jobs in 2015.  That’s over 1.2 million jobs a month – a far cry from the job growth currently hovering around 240,000 a month on average for the first 11 months of 2014.

So the next time you hear news about the rosy picture of the US economy based on the unemployment rate, take a moment, breathe, and think about all those poor souls who have given up looking for a job.