
With all due apologies to The Who, the title of this post is inspired by the same cynical sentiment woven throughout and aptly summarized in the closing line of their classic song Won’t Get Fooled Again. My cynicism is directed at the academic and professional economists who seem to ignore the breadth of US economic history (and human nature) and argue that, somehow, we are now in a unique situation not seen anywhere in the tumultuous upheavals of the past. That the store of US ingenuity and invention has run its course and we, and perhaps the entire world, are stuck at new normal of low economic growth. To these useful idiots I rejoin one of the wisest lines from the same tune ‘And the world looks just the same and history ain’t changed’.
To set the stage for my jaded view on these vapid practitioners of the dismal science, let’s take a look at a bit of economic data. A simple visit to the Bureau of Economic Analysis is all it takes to get gross domestic product (GDP) figures in Excel from the years 1929 to 2016. Yep, one URL, one click, and one download is all it takes.
I’ll confine myself to the first three columns containing year, GDP in billions of current dollars, and GDP in billions of chained 2009 dollars. The year column is self-explanatory but the other two are worth reviewing. The second column (GDP in current dollars) is the BEA’s best estimate, to the nearest 0.1 of a billion dollars, of the monetary value of all the goods and services produced within the US in a given year, expressed in that year’s dollars. The third column (GDP in chained 2009 dollars) contains the BEA’s best estimate as to the value inflation-adjusted to 2009. I can’t speak to why 2009 is chosen as the anchor.
When graphed, the GDP values, which show a general upward trend, also reveal the scars inflicted on the economy over these past 88 years.
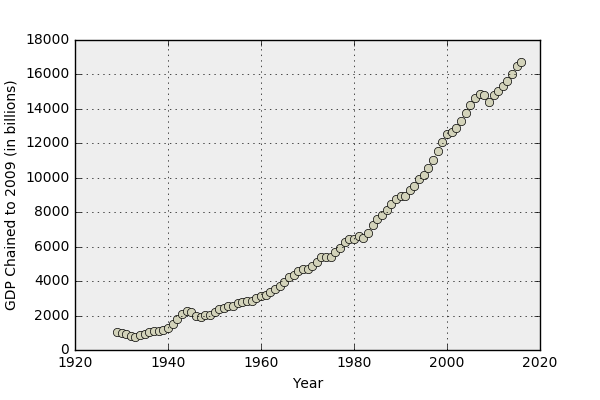
The Great Depression’s presence is clear in the minimum in the GDP in 1933. The wartime bump in 1941-1945, the post-war let down, the stagflation of the mid-seventies, the recession in 1991 are all noticeable. But few features are as pronounced as the onset of the Great Recession and the subsequent lower rate of growth.
GDP growth is defined by taking the difference in GDP’s between two subsequent years and dividing by the earlier of the two. A plot of the resulting percentages,

while open to a wide range of interpretations, looks like a system that is settling to a tighter operating range after a rather turbulent start. The horizontal line represents the average value of 3.34 over the 87-year period.
A zoom into ‘recent’ history
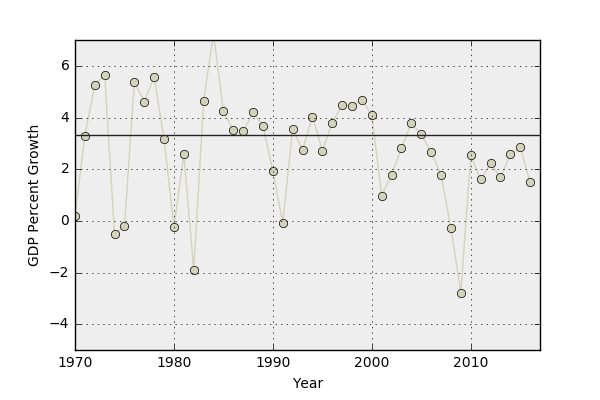
shows a pronounced drop in annual growth in the post-Great Recession recovery. Quantitatively, the average GDP growth over the time span from 1970-2007 (inclusive) was 3.09 percent. This time frame includes the stagflation of the mid-seventies (runaway inflation and high unemployment), the 1987 Stock Market crash, the 1991 recession, and the 2001 tech bubble collapse as well as the Reagan recovery, and the ‘new digital economy’ of the mid-nineties. The average GDP growth over the time span from 2010-2016 has been 2.13 percent, nearly a full percentage point lower than the short-trend average and 1.2% lower than the full long-term trend. If the time span from 1929-2007 is considered, the average GDP growth is 3.58 percent (even including the Great Depression), making the recent sub-par growth even worse.
All sorts of theories have been concocted by the intelligencia to justify this ‘new normal’. For example, John Fernald, in his October 11, 2016 article entitled What Is the New Normal for U.S. Growth?, states:
He further argues that ‘the new normal pace for GDP growth…might plausibly fall in the range of 1½ to 1¾ %...based on trends in demographics, education, and productivity.’
David Houle offers a slightly different interpretation. In his article Low inflation and GDP growth is the new normal, dated August 15 2016, Houle lays the blame at the feet of:
In the regular column Buttonwood’s notebook, published in The Economist June 2, 2016, the author had this to say
Leigh Buchanan’s piece entitled Report: 3 Percent U.S. GDP Growth Rate Is Unrealistic, published in Inc. on May 19, 2017, in which she relies heavily on the opinion of Marc Goldwein, senior policy director at the Committee for a Responsible Federal Budget. Buchanan closes her piece in dramatic fashion by saying
And finally, rounding out our sample, is Mark Thoma’s What if slow economic growth is the new normal? (CBS News’ MoneyWatch on September 19, 2016), wherein he cites Robert Gordon’s explanation for this historical suppression of growth in the US, saying it is that
Of course, there were many, many more jumping on the ‘new normal’ bandwagon.
Rare (and unheeded) was the voice speaking that 3 percent growth was again realistically possible.
But here we are, with revised estimates for 2017 Q2 and Q3, showing two successive quarters with GDP growth over 3%, and that trend seems to be continuing into the fourth quarter. I won’t try to guess what policies have changed but clearly something has. And, for this analysis, it isn’t actually important to figure out what the change is. It is simply worth pointing out that all of these prognosticators and economic pundits were wrong – dead wrong.
Human economy is a complex thing with an immense number of moving parts. It is the height of arrogance to somehow label ‘now’ as extraordinary compared to ‘then’. By what measure do you say that the transition from pre- to post-WWII US involvement was less ‘globalizing’ than the current trends now? By what technological yard-stick do you argue that the advances from 1862 (the final publication of Maxwell’s equations) to 1929 (Solvay conference) are more important than the progress from 1990 (dawn of the internet) to 2017 (bio-engineering, quantum entanglement)? Has human nature changed recently so that the period from 2009 to 2016 must be analyzed differently than the periods before (conveniently all lumped in as the ‘old normal’)?
You may be wondering why, then, did these pundits jump on the ‘new normal’ bandwagon in the first place. There are looks of possible reasons. No doubt some of them wanted to be seen as wise and erudite, others succumbed to the all-too-human tendency to view the current age as somehow harder that all others (‘in my day…’), some had an agenda for talking the economy down and some wanted to avoid controversy by criticizing the policies of the time. And, as interesting as it may be to diagnose why they said what they said, the real question is why did any of us listen to them. Maybe next time we won’t be fooled again.